Trends In The US Economy
 Differences between the Canadian and US economy
I rather focus my attention on the US economy than on the Canadian economy.
I see the Canadian economy as huge gas station for the US and a huge ATM machine. The biggest drivers of the Canadian economy are the oil companies and the banks. You take those two sectors from the index and there is no Canadian economy.
Any Canadian investing his money in the Canadian index may think that he’s diversified but he’s not, he’s invested in two sectors: Financials and Energy.
The US economy is more diversified
On the other hand, the US economy is more diverse.
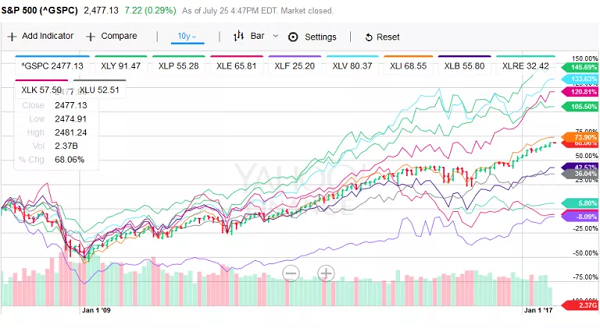
Generally, the easier way to invest in the US is to buy the S&P 500 index, this index represents the 500 largest companies of the US. This is one of the best set-it-and-forget-it strategies. Over the last 10 years, the S&P 500 index has increased in value 68%. This time period includes the financial crisis of 2008 in which the US economy tumbled almost 50%.
If we look closer into the S&P index, we will discover that it is composed of many industries, all of them well represented in the index. Those industries are:
- Discretionary
- Staples
- Energy
- Financials
- Health Care
- Industrial
- Materials
- Real Estate
- Technology
- Utilities
But as you can imagine, not all of those industries grow at the same rate. Some go up, others go down and others stagnate.
The US economy is constantly changing. 200 years ago 90% of the economy was based around farming. Nowadays no one thinks of farming. 200 years ago, we didn’t have a technology sector, now we can not live without technology.
Who is the leader and who is the lagger
I went back and looked at the Spider Industry Sectors for the past 10 years to see which industries have been producing most of the gains for the S&P and which industries have been a drag. Here are the returns:
- Discretionary + 145%
- Health Care +133%
- Technology +120%
- Staples + 105%
- Industrial + 73%
- Materials + 42%
- Utilities + 36%
- Real Estate + 5% (This is a new sector, there is only 1 year of data)
- Energy – 5%
- Financials – 8 %
Here is a graphs which represents all those returns.

What narrative could we build from these numbers?
Reversion to the mean
There is the reversion to the mean theory which suggest that prices return to a mean average. If we believe this theory, Discretionary, Healthcare, and Technology, will either slow down or retrace. And Financials, Energy and Utilities will increase in value. People who follow this theory have a tendency to re balance their portfolio once a year, selling their winners and buying the losers.
I have news for these people: Agriculture will never be a major part of the economy. That time is long gone. Hunting whales to extract their oil to light lamps will never be a major player of the economy. Moby Dick is dead.
Following the trend
On the other hand, I see technology becoming a bigger player in our economy. I see healthcare growing as well. Medicine continues to advance, our life expectancy continues to grow, which means we will need more medicines, more doctors, more everything.
What to do???
It’s dangerous to predict the future. You never know which industry will go up and which industry will go down, that’s why we buy the index, to protect us from our incapacity to pick sectors. But if I had a little bit more money to play around, I would buy a bit more Healthcare and a bit more Technology.
If you had extra money to play with, which sector would you pick?
Note: This article was originally published on http://www.alainguillot.com/.
Category: What's Going On?


