
10 ETF Dividends In Serious Danger
 Exchange-traded funds (ETFs) can be an easy “one-click way” to diversify your dividends. Instead of grinding on the viability of any single payout stream, why not build a basket of them?
But be careful – some pooled payouts are all bad and don’t even keep up with the broader market. In a minute, we’ll review ten dividend dogs masquerading around under the perceived “diversification safety” that ETFs provide.
Make no mistake, there’s a recent rush to ETFs. The 2016 U.S. Exchange Traded Funds Study by Greenwich Associates shows that institutional investors, including pension funds, are increasingly pouring their money into ETFs, from 18.9% of all ETF assets in 2015 to 21.2% last year. And they’re being driven by a number of factors, such as decreasing risk and adding diversity to their portfolios.
Here are ten ETFs paying between 4% and 17% that might look good on paper, but are actually paper tigers.
SPDR S&P International Dividend ETF (DWX)
Yield: 4.5%
The SPDR S&P International Dividend ETF (DWX) is one of the prime examples of how casting a wide international net can do more harm than good. Double-digit weightings in Australia, the United Kingdom and Canada, and significant weightings in Switzerland and Hong Kong, can cancel each other out when a couple countries falter as others roar. As a result, while DWX yields more than twice the S&P 500, the fund has only outperformed the index once since inception in February 2008, and sports a negative 9% total return versus 114% for the S&P 500 in that time!
Vanguard Global ex-U.S. Real Estate ETF (VNQI)
Yield: 4.6%
The Vanguard Global ex-U.S. Real Estate ETF (VNQI) is the real estate investment trust (REIT) edition of the exact same problem. The U.S. version of the fund, the Vanguard REIT ETF (VNQ), has long been a better overall performer thanks to the infighting of VNQI’s international weights, and it boasts a much more stable yield than the VNQI to boot.
Global X SuperIncome Preferred ETF (SPFF)
Yield: 7.3%
The Global X SuperIncome Preferred ETF (SPFF) boasts one of the highest yields in the preferred-stock space. Alas, this merely serves to make up for poorer-quality holdings, and as a result, SPFF is doomed to underperform rivals such as the iShares U.S. Preferred Stock ETF (PFF) and the VanEck Vectors Preferred Securities ex Financials ETF (PFXF) – just as it has since inception in 2012.
Horizons Nasdaq 100 Covered Call ETF (QYLD)
Yield: 7.6%
The Horizons Nasdaq 100 Covered Call ETF (QYLD) executes an extremely simple options strategy in which the fund holds Nasdaq-100 constituents including Apple (AAPL) and Microsoft (MSFT), then sells covered calls against the Nasdaq-100 to generate income. But because it sells options against the index instead of individual stocks, and only uses one-month contracts, QYLD leaves a ton of value on the table, leading to grossly inferior returns to the Nasdaq-100 that its high yield can’t overcome.
Gartman Gold/Yen ETF (GYEN)
Yield: 7.9%
The Gartman Gold/Yen ETF (GYEN), which creates the effect of buying gold in yen rather than U.S. dollars, isn’t just a high-yield death trap – it’s a perfect example of the shortcomings of basic screeners. A cursory look at sites like Google Finance and ETFdb show that GYEN yields nearly 8%, but every investor should look at the payouts more closely. GYEN yields 8% based on a widely variable annual distribution that includes capital gains. In past years, that “yield” has come out to roughly 4% — on a fund that has underperformed gold itself since inception, no less. Stay away.
Arrow Dow Jones Global Yield ETF (GYLD)
Yield: 8.6%
Even extremely high-yielding funds like the Arrow Dow Jones Global Yield ETF (GYLD) aren’t excepted from the rule that international exposure tends to water down – not improve upon – U.S. performance. The GYLD holds equity, real estate, sovereign debt, corporate debt and global alternatives, and while the yield is great, performance compared to similar U.S. funds is consistently weak.
iShares Mortgage Real Estate Capped ETF (REM)
Yield: 8.8%
The iShares Mortgage Real Estate Capped ETF (REM) provides another important lesson on how sometimes, the diversification of ETFs can actually hold you back. Heavily weighted REM holdings such as Annaly Capital Management (NLY) and AGNC Investment Corp (AGNC) only serve to drag down the fund’s performance and mute the efforts of much better mREITs. This fund has a great headline yield, but a roster full of crap.
The Guggenheim Shipping ETF (SEA)
Yield: 12.1%
Shipping stocks are primarily affected by the Baltic Dry Index, which is a measure of the cost to ship raw materials that acts as something of a global economic indicator. Thing is, global growth continues to slow, and the shipping industry – and the Guggenheim Shipping ETF (SEA) – is filled with decimated stocks with many unsustainably large dividends. A 12% yield will naturally include some risk, but this borders on foolishness.
Credit Suisse X-Links Gold Shares Covered Call ETN (GLDI)
Yield: 15.7%
Gold prices go through cycles, and the Credit Suisse X-Links Gold Shares Covered Call ETN (GLDI) tries to spare investors from the pain of regular slides in the yellow metal via the same concept as GYLD – going long the GLD, then selling covered calls against it. However, despite a very impressive yield well in double digits, the GLDI has actually underperformed the GLD since inception, -25.9% to -26.5%. Talk about frustrating!
Credit Suisse X-Links Silver Shares Covered Call ETN (SLVO)
Yield: 17%
Silver might be second on the podium, but it’s first on our list. The GLDI’s sister fund, Credit Suisse X-Links Silver Shares Covered Call ETN (SLVO), doles out a whopping 17% in income, making it one of the highest-yielding ETFs on the planet. Yet in four years of trading, SLVO has only outperformed the iShares Silver Trust (SLV) with a -28.2% loss, versus -28.7% for the SLV. That’s because the options strategy, while great for generating income, limits upside potential that keeps them from joining in rip-roaring runs.
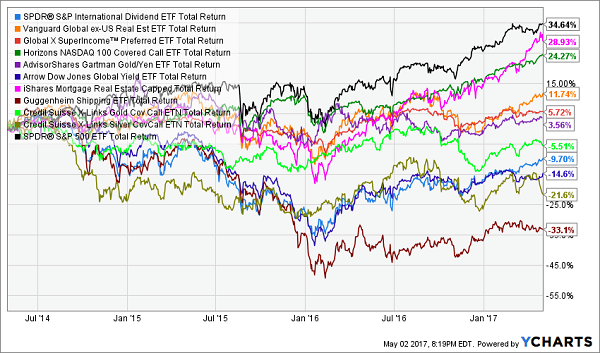
Think I’m being harsh on these funds. All 10 of them have underperformed a simple S&P index fund in recent years (indicated by the black line on top):
These 10 High Yields Just Couldn’t Beat the Market
The Retirement Portfolio You NEVER Have to Touch!
When you’re hunting down retirement holdings, you absolutely need big headline yields. That’s why investors often flock to these funds in the first place. But when they’re backed by poor investment strategies, an 8% annual yield can easily turn into a 4% annual return … or 2%, or 0%, or worse. Those kinds of performances can literally set back your retirement timetable by years!
If you want to retire comfortably, you need a multi-tooled portfolio that not only offers big headline yield, but also dividend growth and the potential for capital gains, too!
And you can find these kinds of “triple threat” stocks in my “No Withdrawal” retirement portfolio.
I’ve spent months researching high-yield stocks looking for the ultimate dividend plays that deliver everything we need to build a successful retirement portfolio. I had to weed out numerous yield traps like the 10 loser ETFs above, but it was worth it, because it resulted in this can’t-miss portfolio featuring:
- No-doubt 6%, 7% even 8% yields – and in a couple of cases, double-digit dividends!
- The potential for 7% to 15% in annual capital gains
- Robust dividend growth that will keep up with (and beat) inflation
Let me show you the path to a no-worry retirement. Click here and I’ll provide you with THREE special reports that show you the path to building a “No Withdrawal” portfolio. You’ll get the names, tickers, buy prices and full analysis of their wealth-building potential – and it’s absolutely FREE!
Category: Dividend ETFs


