5 Diversified Vanguard Funds Paying 4% Or More
 Vanguard’s offerings don’t usually attract much attention from income investors. But they should – and I’m going to analyze five of the firm’s highest yield (and low cost) offerings shortly.
Three of them are compelling portfolio conveniences, while two have lagged their competitors in disappointing un-Vanguard-like manners.
While Vanguard provides a few actively managed funds, for the most part, it sticks to basic index funds and straightforward smart-beta funds in both the equity and bond arenas. The firm doesn’t delve much into the kinds of riskier strategies that tend to result in higher yields, nor does it deal in exchange-traded notes or leveraged funds that would allow it to gin up extra income.
In fact, of Vanguard’s 70 ETFs, a mere five boast yields of more than 4% currently. But investors would be wise not to sleep on this small list of Vanguard ETFs, as their dirt-cheap costs make each of them a candidate for important satellite income holdings for just about anyone.
Vanguard Long-Term Bond ETF (BLV)
Dividend Yield (SEC): 4%
Expenses: 0.09%
The Vanguard Long-Term Bond ETF (BLV) is, as the name would suggest, a way to access longer-dated debt.
BLV holds more than 2,100 different investment-grade bond issues. And while the fund is, as one would expect, chock-full of Treasury and agency bonds (at nearly 40% of the fund), industrial corporate debt makes up a significant chunk of BLV’s holdings, at about 36%. The rest of the fund is split mostly among debt from financial corporations, utilities and foreign entities.
The “long-term” moniker comes from the fund’s average maturity of just more than 24 years.
The upside? Long-dated bonds are naturally income-friendly, as the issuer has to pony up more interest for the added risk of all those extra years. The downside? Long-term bonds are extremely sensitive to interest-rate changes – precisely why BLV was so strong in the first part of 2016 as a rate hike was shelved, and why it dipped hard as a late-year increase in rates seemed increasingly likely.
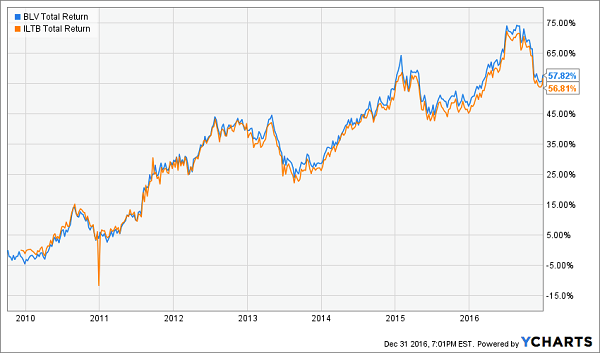
BLV’s particular mix of both long-term corporates and Treasuries make it stick out, as there are few similar products on the market. The iShares Core 10+ Year USD Bond ETF (ILTB) is one of the most comparable rivals, offering a similar makeup of debt sources and duration, and even that’s a difficult comparison because of ILTB’s inclusion of junk debt.
Still, despite ILTB’s access to higher-yield junk debt, the BLV still earns the edge on total returns in the long-run, besting iShares’ product by about a percentage point since the start of 2010.
Vanguard’s BLV Delivers Long-Term Returns
Vanguard Long-Term Corporate Bond ETF (VCLT)
Dividend Yield (12-month): 4.6%
Expenses: 0.07%
Vanguard’s VCLT is much more of a garden-variety fund, tackling solely long-term corporates – an area of investment with a few more competitors.
The makeup is pretty similar to BLV in that effective maturity is just under 24 years, and average duration is just under 14 years, across its nearly 1,800 holdings. Moreover, VCLT has the same corporate focus as BLV, with the heaviest weight going to industrials (nearly 70%), and the vast majority of the rest split between financials (17%) and utilities (13%).
Here, VCLT’s advantage against the competition is a little more pronounced. Not only does it outdo the iShares 10+ Year Credit Bond ETF (CLY) – a much more diverse sector spread of corporate debt – by more than 8 percentage points since 2010, but it also tops similarly constructed SPDR Bloomberg Barclays Long Term Corporate Bond ETF (LWC).
Vanguard’s VCLT Leads the Pack
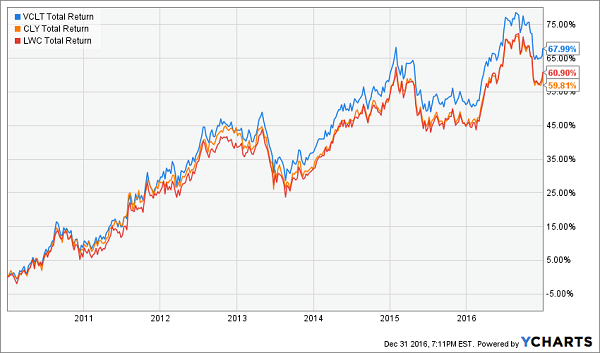
Moreover, it’s the cheapest of the trio.
Vanguard REIT ETF (VNQ)
Dividend Yield (12-month): 4.8%
Expenses: 0.12%
The Vanguard REIT ETF (VNQ), which came to life all the way back in 2004, is by far and away the biggest player in the real estate investment trust space. At $58.7 billion in assets under management, VNQ dwarfs the next closest player, the iShares U.S. Real Estate ETF (IYR), which has amassed “just” $4.2 billion.
If you’re looking for broad exposure to the real estate sector, VNQ aptly provides it. The ETF provides a good distribution across several types of real estate, led by retail at 23% of the fund. Specialized (16%), residential (15.5%), office (13.5%) and healthcare (12%) all get double-digit weightings, while diversified, industrial and hotel & resort REITs round out the rest of the fund.
Here again, Vanguard finds itself at the top of the pile. Since 2010, Vanguard leads a group of major providers’ competing products. The most exaggerated outperformance is versus the IYR, which is more than 15 percentage points behind.
Vanguard’s VNQ Leads the REIT Way
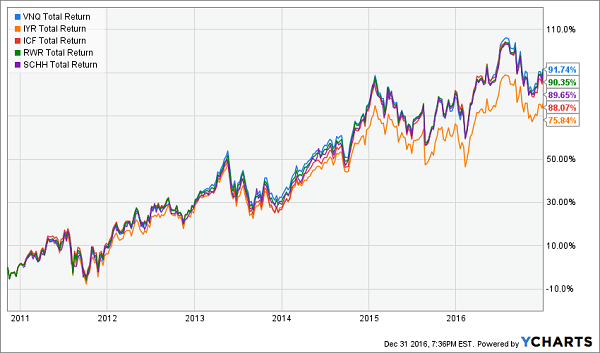
(As a note, inception for the Schwab U.S. REIT ETF (SCHH) was not until Jan. 13, 2011; however, VNQ has outperformed it since then by a few basis points.)
Vanguard Emerging Markets Government Bond ETF (VWOB)
Dividend Yield (SEC): 4.8%
Expenses: 0.34%
We’ve pointed out before that emerging-market government debt can be not just a source of high-yield income, but a quality one. Vanguard’s entry into this space is the Vanguard Emerging Markets Government Bond ETF (VWOB).
Unlike the VanEck Vectors Emerging Markets High Yield Bond ETF (HYEM) that we highlighted earlier, VWOB is solely sovereign debt. But that doesn’t make it any less risky. In fact, just about 40% of the fund’s 949 bonds are rated lower than Baa, earning “junk” status. Another 36% of the fund is Baa, which is considered medium-risk. That means just about a quarter of VWOB’s debt is actually considered investment-grade.
That said, don’t fret. Vanguard Emerging Markets Government Bond ETF is diversified across more than 60 emerging- and frontier-market debt. Even its one double-digit weight is in China – not much of a default worry. Meanwhile, Mexico and Brazil each make up more than 7% of the fund, and Russia, Indonesia and Turkey debt each account for more than 5% of VWOB’s weight.
Here, Vanguard hasn’t had as much success.
VWOB Struggles Against Emerging-Market Competitors
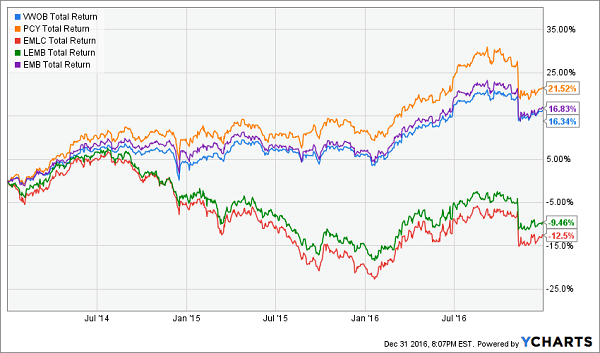
The chart above actually has two purposes. For one, I want to show VWOB’s returns, which haven’t been as successful as similar offerings from iShares and PowerShares. The latter’s Emerging Markets Sovereign Debt Portfolio (PCY) is a particularly balanced fund where Venezuela is the top holding at just 4.2% in weight.
But I also want to show you the difference between funds that hold debt denominated in U.S. dollars, and those that hold debt denominated in local currency. The former has been (and will continue to be) more successful in a strong-greenback environment. The latter – funds such as VanEck Vectors J.P. Morgan EM Local Currency Bond ETF (EMLC) and iShares Emerging Markets Local Currency Bond ETF (LEMB) – have struggled, and will continue to be the lesser option as long as the U.S. dollar continues to be the globe’s currency of choice.
Vanguard Global ex-U.S. Real Estate ETF (VNQI)
Dividend Yield (12-month): 5.2%
Expenses: 0.18%
Vanguard’s highest-yielding fund at the moment is also, unfortunately, one of its least impressive.
The Vanguard Global ex-U.S. Real Estate ETF (VNQI) is an internationally focused real estate fund that invests in REITs across a number of developed and emerging-market countries. VNQI dedicates nearly a quarter of its holdings to Japanese real estate equities, another 13% to Hong Kong, nearly 8% to China and almost 6% to Singapore, giving the fund a heavily Asian feel.
But the “ex-U.S.” part of its name is perhaps the most important aspect of VNQI right now.
The Problem With Global Real Estate? The Rest of the Globe
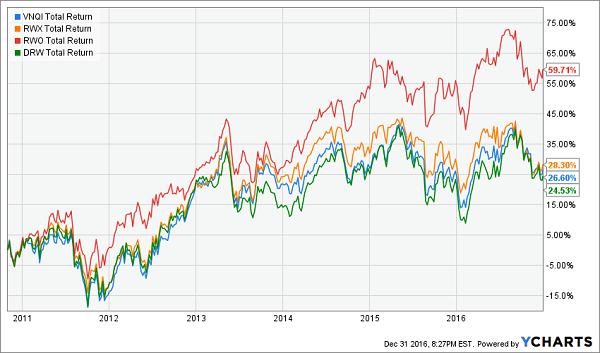
You’ll see above that VNQI sits in a tight group of international real estate funds since inception in late 2010. You’ll also note the outlier – the SPDR Dow Jones Global Real Estate ETF (RWO). Many so-called “global” funds actually hold a significant share of U.S.-based assets, and RWO is no exception; 63% of its holdings are American. But wherever you see “ex-U.S.,” you’ll see far more muted action.
Why the underperformance? It’s really a smattering of issues, from fears of a bubble in China to the struggling economies of developed-market nations. Regardless, it likely will take a broad global economic pick-up to get VNQI into an extended uptrend – until then, expect the peaks and valleys that we’ve seen for the past couple of years, with income helping to pad the lean times.
4% is a Start, But Secure 8% Yields are Achievable
These funds are a good start – but as you know, 4% yields probably aren’t enough to let you retire on dividends alone.
That’s because you need about 8% in annual returns to get to where you want to be.
For many high-yield ETFs that waver depending on the market environment, that’s a tall task. But my favorite stock can get you that – in cold, hard cash alone!
Let’s say you have a half-million dollars invested for retirement. Even with interest rates ticking higher, bonds will still net you, what, $15,000 every year? Even with Social Security tacked on, that’s not a comfortable retirement.
Thanks to medical advances, you and I are going to live much longer lives – but that means our money has to work harder, and longer, for us. Realistically, we need to be making about $40,000 annually on every $500,000 invested. That’s about 8%, which is more than the market returns on average.
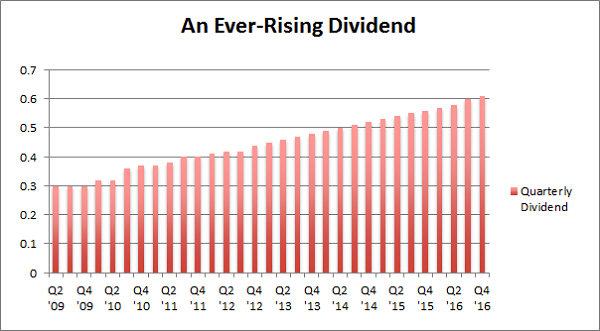
That’s why I’ve set my sights on a particular dividend stock right now that not only yields 8.5% right now, but also raises its dividend each and every quarter! So forget 8% in annual returns – if you also add in the projected capital gains on this sure-fire pick, you can expect a total return 17% between dividends and capital gains every single year!
I specialize in uncovering contrarian 8%+ income opportunities like my ever-rising dividend pick. Click here and I’ll explain more about my strategy and my favorite stocks and funds to buy for a secure retirement on just $500,000.
Category: Dividend ETFs


