6 “Retirement Maker” Funds Paying Up To 10.8%
 Today we’re going to discuss six “retirement maker” funds that pay dividends up to 10.8% annually. You will not find these types of yields in mainstream financial publications. Here’s why.
It’s important for you to fade Wall Street’s advertising machine and buy value, not hype – especially when it comes to dividend payers. Stick with excellent yet off-the-beaten-trail CEFs (closed-end funds) and ignore the marketing machines promoting their latest overrated ETFs (exchange traded funds).
Please, Whatever You Do, Don’t Buy Bond ETFs
Be careful how you buy your bonds. The most popular tickers have a few fatal flaws that’ll doom you to underperformance at best, or leave you hanging in the event of a market meltdown at worst!
Let’s pick on the widely followed and owned iShares iBoxx High Yield Corporate Bond ETF (HYG) as an example. It has attracted nearly $15 billion in assets because:
- It’s convenient, as easy to buy as a stock.
- It’s diversified (for better or worse, as we’ll see shortly) with 998 individual holdings.
- It pays 5.8% today.
The accessibility of funds like HYG appears cute and comfortable enough. But remember, ETFs are marketing products. They are designed to attract capital for the managers, not necessarily to earn you a return on the capital you invest.
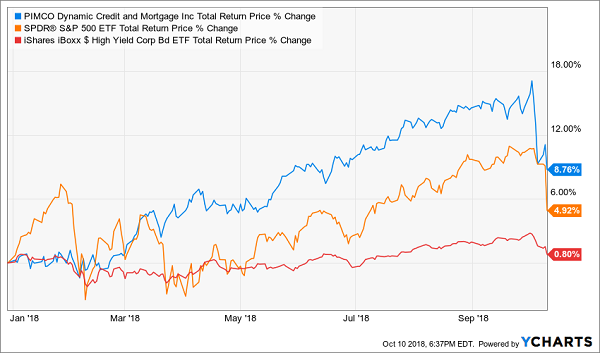
And year-to-date, HYG has done exactly what its marketing managers intended. It’s attracted a boatload of money, paid its dividends, and… delivered zero value to shareholders:
HYG: The Worst of Both Worlds

Big money is spent on television, print and online advertisements for ETFs. Less cash and thought is put into the actual income strategies that big ETFs employ, and their lagging returns reflect it.
Today, I will show you three popular ETFs that investors should sell today. We’ll also discuss a superior alternative for each investment.
VanEck Vectors Preferred Securities ex-Financials ETF (PFXF)
Dividend Yield: 6.3%
Expenses: 0.41%
Replaces: iShares Core U.S. Aggregate Bond ETF (AGG, 2.6% Yield)
The important thing to remember about the 15% average rate of return on your portfolio is that it’s an average rate of return. Some holdings will deliver less, others will deliver more. What we want to do here is raise the average across the board to get to that 15% – including on the low end.
The iShares Core U.S. Aggregate Bond ETF (AGG) is the most popular bond exchange-traded fund (ETF) on the market, at just more than $54 billion in assets under management. Investors pile their money into funds like AGG and its rivals because investment-grade debt tends to be pretty stable, and they accept a modest amount of yield for that.
But you don’t have to accept a sub-3% payout for stability.
Preferred stocks are a stock-bond “hybrid” that has elements of each. On one hand, preferred shares still represent ownership in the company (like common stock), but you typically don’t get a vote (more like a bond). They also pay out a regular, fixed distribution like a bond – one that’s typically much higher than the yield on common stock, say between 5% and 7%. Like bonds, they tend not to appreciate much, and instead trade around a par value; returns are mostly from the income.
The VanEck Vectors Preferred Securities ex-Financials ETF (PFXF) – born during the recovery from the Great Recession, when investors feared another collapse in banks – is a way to upgrade your safety allocation. It invests in a basket of 100 preferred securities that results in a dividend yield north of 6%.
What sets PFXF apart from most other preferred-stock ETFs is that it excludes the financial sector – typically the highest-weighted area in rival funds. Instead, it’s most heavily invested in electric utilities, REITs and telecom stocks, with preferred holdings coming from companies such as NextEra Energy (NEE) and AT&T (T).
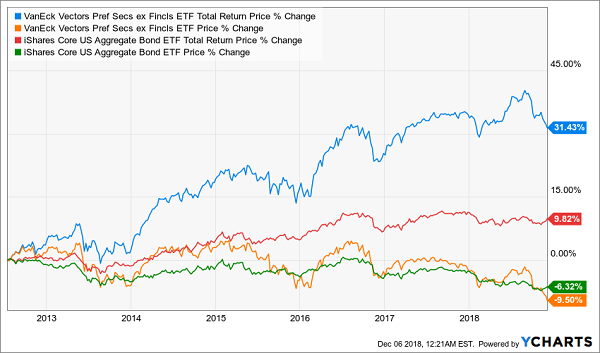
PFXF: A Beautiful, Boring Way to Collect Far Better Returns Than Bonds

As you can see from the green and orange lines, PFXF is a little more volatile than AGG, but not much. But the rewards? Far greater. That’s a compromise everyone can be happy with.
Templeton Emerging Markets (EMF)
Distribution Rate: 7.9%
Expenses: 1.38%
Replaces: Vanguard FTSE Emerging Markets ETF (VWO, 2.7% Yield)
I typically don’t deal with emerging markets that much such as Brazil, China, India and Russia. Their stocks are too volatile – unless you buy in bulk.
Funds such as the Vanguard FTSE Emerging Markets ETF (VWO) are a much more favorable way to buy emerging markets because you’re spreading your risk across hundreds of stocks across dozens of countries. That way you can participate in some of the growth, though admittedly, funds like these have several bad apples that wash out the strong performances of others.
And the yields are still pretty paltry. VWO dishes out 2.7%, which is actually considered good for emerging markets.
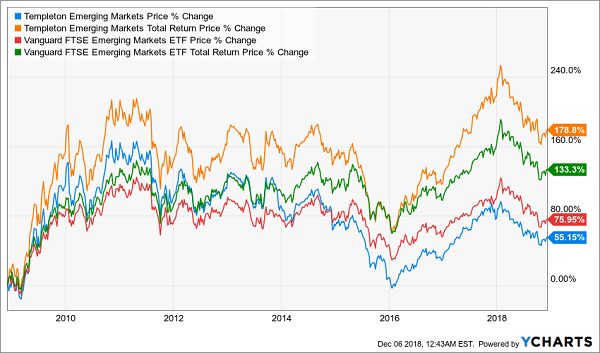
Templeton Emerging Markets Fund (EMF) delivers a lot more – its distribution rate is almost 8% – and provides a better total return than VWO to boot.
Templeton’s EMF is a portfolio of more than 80 holdings split amongst more than a dozen emerging markets. China (21.6%) is the largest geographic concentration, which is typical for an EM fund. After that is South Korea (15.7%), Taiwan (10%), Brazil (7.8%) and Russia (7.5%). Again, typical. And EMF’s individual holdings are pretty standard fare: Korean electronics giant Samsung, South African multinational internet company Naspers (NPSNY) and chip foundry Taiwan Semiconductor Manufacturing Co. (TSM).
Management, and its decision to hold certain stocks at much different percentages than the index (and to hold certain stocks the index doesn’t hold) is what ultimately makes this a superior fund. Templeton Emerging Markets is slightly more volatile than VWO, but not much, and ultimately delivers superior returns over the long run.
EMF: How to Turbo-Charge Your EM Returns

Liberty All-Star Equity Fund (USA)
Distribution Rate: 10.8%
Expenses: 1.01%
Replaces: SPDR S&P 500 ETF (SPY, 1.8% Yield)
The SPDR S&P 500 ETF (SPY) is No. 1 with a bullet. It’s the largest ETF on the market by AUM, and it’s not even close, with $260 billion in assets – that’s $100 billion more than its closest competitor, the iShares Core S&P 500 ETF (IVV). It’s the way Americans play American stocks.
But it’s not the best way to play them.
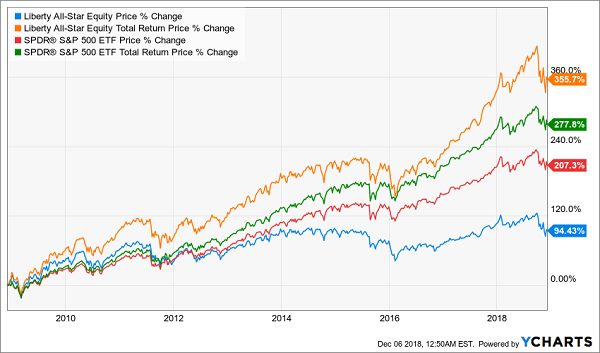
Liberty All-Star Equity (USA) is a closed-end fund (CEF) that has beaten the pants off the SPY on a total-return basis for years. Despite that, and despite the marketable ticker symbol, USA is a relative shrimp at just $1.1 billion in assets.
What’s a Better Way to Play the USA? Well … USA!

There’s no “trick” to Liberty All-Star Equity – it’s just a quality fund run by quality management. USA’s assets are managed in equal portions among five investment managers – three value specialists and two growth firms. Its holdings are mostly what you’d see in the SPY, including the likes of Amazon.com (AMZN), Adobe Systems (ADBE) and Visa (V), just at different weights than the S&P 500 Index.
Most of the company’s returns come not through price appreciation but the distribution, which includes dividend income but also performance. And the superior total return reflects the skilled five-pronged management team that has for years put the index to shame.
Retire on Just $500K with These 3 CEFs Paying up to 9.4%
Secure closed-end bond funds are a cornerstone of my 8% “no withdrawal” retirement strategy, which lets retirees rely entirely on dividend income and leave their principal 100% intact.
To achieve this, I research and recommend only elite closed-end funds that:
- Pay 8% or better…
- Have well-funded distributions…
- Trade at meaningful discounts to their NAV…
- And know how to make their shareholders money.
If you’re an investor who strives to live off dividends alone, while slowly but safely increasing the value of your nest egg, these are the ideal holdings for you. Click here and I’ll explain more about my no-withdrawal approach.
Category: Closed-End Funds (CEFs)


