
Revealed: My Safe Fund-Picking Strategy For 7.5%+ Payouts
 Here’s something few people realize about closed-end funds (CEFs): sometimes, when it comes to these funds, matching the market means you’re actually beating the market.
Let me show you what I mean using the AGIC Equity and Convertible Income Fund (NIE), a CEF I recommended earlier this year. NIE has been meeting the S&P 500’s performance, though most people don’t know it.
And by meeting the S&P but giving investors a 7.5% dividend yield, it’s helped income investors actually beat the market if they’d chosen a “dumb” index fund like the SPDR S&P 500 ETF (SPY) instead.
First, let’s address the hidden returns.
If you fire up Yahoo Finance or Google Finance and look up NIE, you’ll see something like this:
A Crummy Return on the Surface…
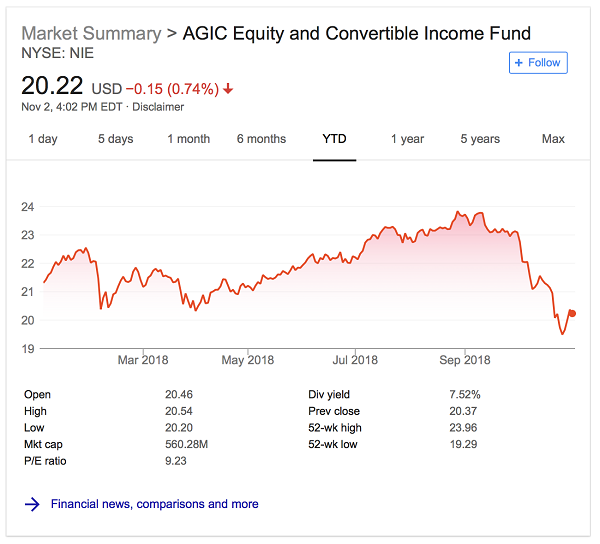
Source: Google Finance
Looks bad, right? According to this chart, NIE is down 4.3% in 2018 alone, while the same search for SPY shows a 1.9% year-to-date positive return:
… That Is Trailing the Index …
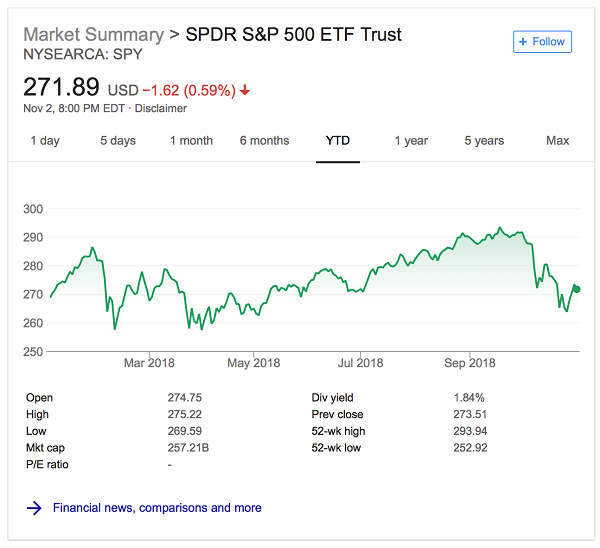
Source: Google Finance
This is about as far as a lot of income investors go—which is why the CEF market is so deliciously inefficient (providing smarter investors a chance to make massive profits!), and why NIE can be a great buy at certain times.
You see, the NIE chart above hides a couple things. For one, it’s simply a price chart that doesn’t include dividends—for that we need a total-return price chart, which shows NIE up 0.7%.
That’s much better, but it’s still misleading.
You see, the discount between the value of NIE’s portfolio (or net asset value—NAV) and the fund’s market price has widened in the last few weeks, after narrowing briefly earlier this year.
That’s why the total-return price is much lower than the total NAV return, which takes into account dividends and the portfolio’s fundamental, real-market-price value.
When we pull up NIE’s NAV chart and compare it to that of SPY, we suddenly have a totally new view on this fund.
… But Is Doubly Misleading!
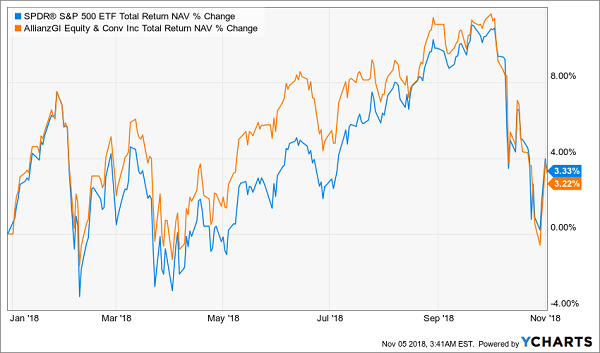
This kind of chart isn’t available on Yahoo or Google, and that’s why so many people ignore CEFs: they’re looking at less than half the real story!
And that’s a big deal: NIE’s underlying portfolio is matching the market’s performance, even during this recent bout of volatility.
When a Tie Is a Win
So now let me tell you why a CEF with a NAV that’s matching the market’s performance is actually a win for the income investor.
Imagine you’re holding $100,000 in SPY and you withdraw $1,875 every quarter to pay your bills. Because of your need for income at regular intervals, you are selling whether the market is up or down—which eats into your returns.
For instance, imagine an investor who withdraws that $1,875 on or near the last day of every quarter; in 2018, this is how it would work out:
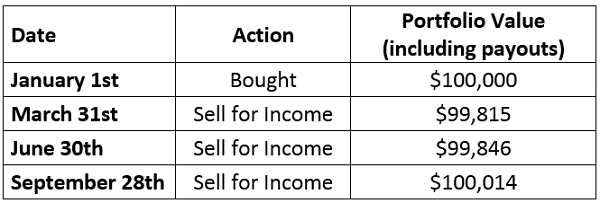
Note that you’ve spent half of the year down and only as of September 28th did you come up barely (.014%!) ahead of the game. Oh, and I didn’t include commissions—with most brokerages, the 3 sales would end up with at least $15 in commissions, thus erasing your puny gains for the year.
Now let’s look at the same time period with NIE. This is a lot easier, since we just buy once, at the start of the year, then sit back and let the payouts come to us.
Here’s what our NIE investment would look like for each dividend payout, based on the fund’s market price:
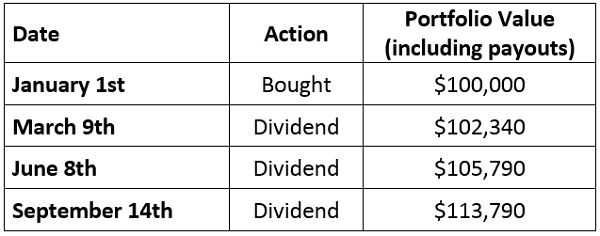
Notice how the portfolio value is higher at the end and remains positive during our payouts? This is partly because NIE’s holdings have outperformed those of SPY for much of 2018.
The reason for this is that NIE’s money managers have control of when they sell assets in the fund’s portfolio to fund investors’ money needs. They can thus sell when the time is right.
Unlike the do-it-yourself investor selling at regular intervals because they need the cash, NIE’s money managers can sell from a much larger pool of assets when they want to sell. Not being forced to sell at a loss means having the freedom to invest wisely—and that always means higher profits.
Why would you want to approach the markets with one hand tied behind your back? With CEFs, you don’t have to.
7 Contrarian High-Yielders for Any Market
Besides, when you’re nearing retirement or already retired, all you really care about is generating consistent income and protecting your hard-earned nest egg, whether the broader market is up 10% one year or down 10% the next.
The good news is: there’s a better way. My colleague Brett Owens has created an “8% No-Withdrawal Portfolio” that generates steady income and impressive capital gains.
Brett’s system could hand you $40,000 a year on every $500,000 invested (in an up market or down one) with under-appreciated income plays like:
- Closed-End Funds (CEFs)- We’ll share our top three CEF picks with you, each of which pay a monthly dividend. Many of these trade at a discount to net asset value, like Pennant Park.
- Preferred Stock- Brett lets you know two of the best active managers in this space to invest alongside with.
- Recession-Proof REITs- discover two REITs that actually benefit from higher interest rates today; rather than waiting for a potential turnaround at name like Investors Real Estate.
That’s 7 contrarian investment picks just to get started. Click here for instant access to the full 8%, No-Withdrawal portfolio.
Category: Closed-End Funds (CEFs)


