
Run Away From SPY, IVV, VOO, And Other S&P 500 ETFs
 A decade after the Global Financial Crisis, investors seem to have forgotten about risk.
The amount of money that has flowed into S&P 500 ETFs in recent years concerns me. With little regard for valuation, investors just continue to pump capital into ETFs that track the main index.
Over the last three years, $100 billion has flowed into the three largest S&P 500 ETFs—SPY, IVV, and VOO. This year alone, investors have pumped in around $50 billion.
That’s a staggering amount of capital at a time when the market looks overpriced and ready for a pullback.
If you’re invested in an S&P 500 ETF, it’s time to be careful. Contrary to popular belief, these broad ETFs provide minimal diversification.
At the same time, they expose investors to some of the most overvalued stocks in the world.
Here’s why.
Overexposure to FAANG and Other Insanely Valued Stocks
The S&P 500 has risen in a straight line in 2017.
With record low levels of volatility, the index has returned nearly 20% this year. This rise has pushed the market’s valuation up to dangerously high levels.
Yet it’s not just the overall valuation of the index that looks too high. It’s the eye-watering valuations of some of the largest stocks within the index.
Look at the FAANGs, for example.
These stocks have rallied hard in 2017, and several now trade at insane valuations.
Amazon has a P/E ratio of 300. Netflix trades on 190. Facebook and Google trade at P/E ratios of around 35. The FAANGs are priced for perfection right now. These valuations leave little margin for error.
Even worse, the FAANGs make up an increasingly large part of the index. Over the course of 2017, the index weight of these five stocks has increased from under 9%, to almost 11%.
While you would think that a 500-stock index would be well diversified, a closer analysis of the S&P 500 reveals an alarming picture.
Apple has a near 4% weight within the index. Google contributes almost 3%. Amazon and Facebook combine for another 4%. In total, the five FAANG companies make up around 11% of the index alone.
But it gets worse.
The index is also heavily skewed to the technology sector. Five of the top 10 holdings are tech stocks.
Adding to the weights of the FAANGs in the top 25 holdings are stocks such as Microsoft (2.9%), Intel (0.9%), and Cisco Systems (0.8%).
All up, the technology sector amounts to close to a quarter of the index. That’s up from 18% just four years ago.
At the peak of the dot-com bubble, the tech sector had a weighting of almost 35%. It fell to around 13% in the crash.
The composition of the index means that investors have the highest exposure to a sector that offers minimal upside right now.
Diversification Myth
While you may believe that a 500-stock index would provide strong diversification benefits, the chances are, you’re not as diversified as you think you are.
That’s because every investor owns the same basket of stocks.
Investors have neglected company fundamentals, and instead poured billions into stocks as a whole. Stocks have become a singular entity. Investors did the same thing to commodities a decade ago and look what happened there.
In a market pullback, investors will all be selling the same basket of stocks. The equity index flows will reverse.
Investors will realize they’re not diversified, after all. It could get ugly.
Growth vs. Value Gap
Also remember that S&P 500 trackers, by definition, ignore valuations and fundamentals.
So while an index tracker will get you exposure to a handful of attractively valued, world-class stocks, it will also buy you plenty of exposure to overpriced stocks.
According to UK investment house Woodford Investment Management, the difference between the performance of value stocks and growth stocks across the US market today is “greater than at any stage in stock history.”
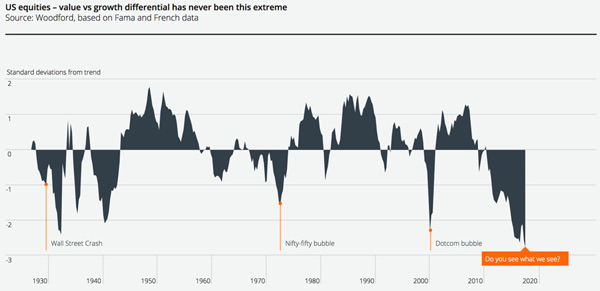
Source: Woodford Funds
Portfolio manager Neil Woodford, one of the UK’s most celebrated investors, recently warned, “there are so many lights flashing red that I am losing count.”
Given his track record of successfully avoiding the dot-com boom and also avoiding bank stocks before the Global Financial Crisis, investors should take note.
To give you a more specific example, look at Twitter. The company has recorded three straight quarters of year-on-year revenue declines. It continues to generate losses. Yet its share price is up 45% this year.
In the current environment, when the performance differential gap between value and growth stocks is extreme, indexing is a very dangerous strategy
It’s for this reason that many professional investors are now hitting the sell button.
Looking at Wall Street SEC filings, large money managers such as UBS and Wells Fargo are dumping S&P 500 trackers. Recent filings show that SPY is one of the most sold stocks by investors managing more than $100 million.
If the smart money is dumping the index, shouldn’t you join them?
Unknown Territory
Lastly, be aware that, because ETFs are a relatively new investment vehicle, their liquidity is yet to be tested in a major bear market.
The S&P 500 tracker inflows in recent years, while large, have been orderly. But what happens in the event of a major market reversal? What if investors all want their capital back at once? Will the outflows be as orderly?
That remains to be seen.
Note: This article was contributed to ValueWalk.com by Mauldin Economics
Category: ETFs


