
Here Is Why We Won’t See The Market Reach A New High
 Stocks are once again rallying after another “mini crash” at the start of the year. We’ve had three of these things since October 2014 without much to show for it. As Adam warned Boom & Bust readers earlier this week, stocks have basically gone nowhere for a year and a half.
After the first crash in late 2014, stocks were able to eke out a new high into May of last year. But since then, stocks have failed to make new highs despite strong attempts like this one.
Ten months without a new high.
That’s only happened at 11 other points in history. And in eight of those instances, we saw a new bear market follow. That’s almost 75%! Even after the 20% correction in 2011, the only major correction in this bubble since March of 2009, stocks hit new highs within 10 months. We’re moving into dangerous territory here.
Two weeks ago I referred to this as a “rounded top pattern,” and we’re testing that trend line which should peak in the 2,070-2,095 area on the S&P 500. If it breaks that level, then a new high would be imminent.
But here’s why I think that’s unlikely…
Coming into the May top and more-so since, small cap stocks have clearly underperformed large caps.
That is the classic sign of a major top!
The dumb money continues to pour in, buying well-known large caps… while the smart money exits after having focused on buying the broader universe of small caps where there is much more opportunity. Your typical investor doesn’t have the sophistication to play that market.
But while they may be able to find some good opportunities in this area… the small caps as a whole have already entered bear market territory, and have no chance of hitting new highs! And that drags on the broader market.
Earlier this year I pointed out the equally weighted Value Line index, which showed the typical stock had already turned bearish. While the S&P 500 was down 15%, this “typical stock” was down 23%, and the small caps were down 27%.
If you’ve got some stocks still flying high while a large group of them are sucking wind, then it’s only a matter of time before the market becomes stretched too thin and rips apart.
At worst, you’ve got the biotech sector that’s been down 40% recently, after bubbling up 600% since early 2009. No chance of new highs there either! Not a good sign to see the leading sector tank.
Even if the large caps did hit slight new highs, it would only worsen this divergence between large caps and small caps. That would signal even more conclusively that a major long-term top is in.
Just look at the environment we’re in. Most other major international markets have already hit bear market levels.
China’s Shanghai Composite down 50% at its worst…
The DAX in Germany down 30%…
The FTSE in Britain down 23%…
The Japan Nikkei down 29%…
And don’t even ask about Greece and Italy!
The last potential holdouts are the large-cap indices in the U.S… otherwise known as “the best house in a bad neighborhood.” The S&P 500 has gotten to within 3% of its all-time high. But there should be strong resistance at the 2,095 level just above here.
Here’s my favorite chart to show why this is not the time to buy stocks, but sell them. This shows the expected returns over the next 10 years based on stock valuations as a percentage of GDP today. As the correlation shows, this has been very accurate in the past:
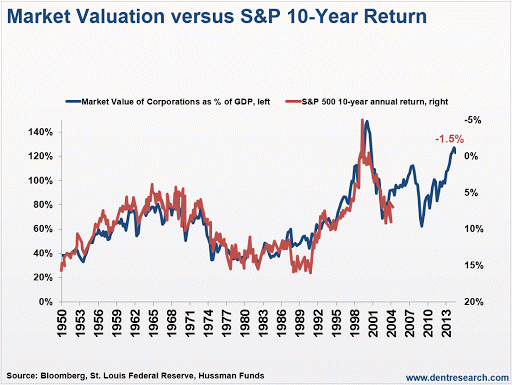
It says that you should expect to lose 1.5% a year for the next 10 years, which means you would lose near 20% over the next decade. I, of course, expect worse as we are in the once-in-a-lifetime winter season where stock crashes are the most devastating.
I’ll take a 10-year Treasury at 2% annual no-risk returns over that any day!
In the update to The Demographic Cliff in paperback I favored a peak in May 2015, but allowed for a substantial correction, followed by one slight new high in 2016. After that, I expect the next great crash towards 5,500 by late 2017.
I still favor the high already being in. But either way, the upside gains are limited to 5% or so in the next few weeks or months, and the downside is 70%-plus in the next two years.
I have continued to warn that it’s better to get out a bit early than too late as bubbles burst at least twice as fast as they build… just ask the Chinese.
Note: The author of this article is Rodney Johnson.
Category: Market Analysis


