June ETF Fund Flows Put A Nail In GLD’s Coffin
 Investors are continuing to pump money into ETFs. With the addition of the June ETF fund flows, total assets in US listed ETFs are up about 6% this year.
It comes as no surprise given the recent revelation that 81% of financial advisers are recommending them to their clients.
Now, more than ever, ETF fund flows are a valuable indicator of what traders are thinking. It takes a lot of buying or selling to drive millions or even billions of dollars into or out of individual ETFs.
Fund flows are something traders use to find trends and gauge investor sentiment. And it can help you pinpoint which ETFs could be next to make a big move higher or lower.
Let’s take a look at the June ETF fund flows and other sentiment indicators for clues to the market’s next move.
The Emotion Driving June ETF Fund Flows…
Fear is the dominant emotion on Wall Street. And for good reason… Greece’s sovereign debt crisis and China’s bubbly stock market have investors on edge.
We see evidence of those fears in soaring put option volume, a higher VIX, and the loss of bullish momentum in US stocks.
It’s unfortunate to see these global macro events weighing down US stocks because we’ve actually seen some great economic data lately. But the way things have been going lately, we need a resolution in Greece before large cap US stocks make a big push higher.
ETFs With The Largest Inflows In June…
Once again, ETFs that hold international stocks dominated the list of largest net inflows in June. For those of you keeping score at home, that’s the 5th month in a row that an international stock ETF has been at the top of the list for net inflows.
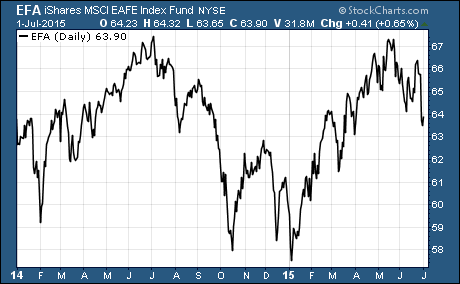
iShares MSCI EAFE ETF $EFA once again led all ETFs with $2.2 billion in net inflows in June. EFA holds stocks from developed markets outside of the US and Canada. These are primarily European, Australasian, and Far Eastern markets.

One thing to keep an eye on is the recent price action of EFA. As you can see, EFA recently completed a round trip from the 2014 highs to the lows in early 2015 and back to the highs from 2014.
A breakout above this key resistance level would be a very bullish indicator for EFA. However, we’re already seeing profit taking accelerate at this technical resistance level over the last few weeks. We could be seeing the epic rally for EFA in 2015 come to an abrupt end.
ETFs With The Largest Outflows In June…
Outflows hit ETFs that hold large cap US stocks, emerging markets, and corporate debt equally hard in June. iShares iBoxx $ High Yield Corporate Bond $HYG, SPDR S&P 500 $SPY, and iShares MSCI Emerging Markets $EEM all suffered outflows of $1.75 billion.
I also noticed the SPDR Gold ETF $GLD is no longer among the top 10 largest ETFs. Back in 2011, GLD was the biggest ETF in the world with $77.5 billion in assets.
Amazingly, it has lost about two-thirds of its assets since reaching that lofty peak… that’s quite the fall from grace for gold bugs.
Here’s the bottom line…
Over the first half of 2015, one thing has become abundantly clear… investors are shifting from a US centric investment philosophy toward a global approach that focuses on all stocks.
This could simply be a way to spread risk around in these times of heightened uncertainty. Or investors could be indicating they believe stocks from outside the US will be the ones outperforming in the weeks and months ahead.
Good Investing,
Corey Williams
Note: Corey Williams writes and edits ETFTradingResearch.com. Sign up for our free ETF reports and free e-letter at http://www.etftradingresearch.com/free-sign-up. We’re devoted to helping you make more money from ETFs.
Category: Market Analysis


