Our February Stock Market Update In 3 Charts
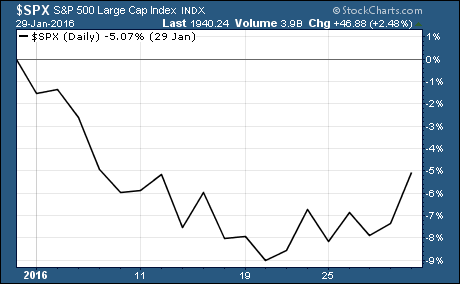
 Investors are in for a tough year if January sets the stage for stock market’s yearly performance. The S&P 500 finished the month down 5%.

What’s more, the poor performance in January has meant that the S&P 500 finishes February with a loss 60% of the time.
Technical February Stock Market Update
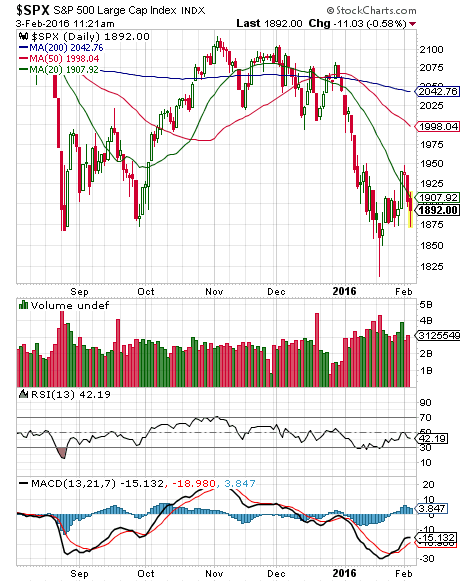
The January selloff caused significant damage to charts of the S&P 500.

The large cap index has been making lower highs and lower lows over the last several months. This is a clear indication that bearish momentum is building.
Fundamental February Stock Market Update
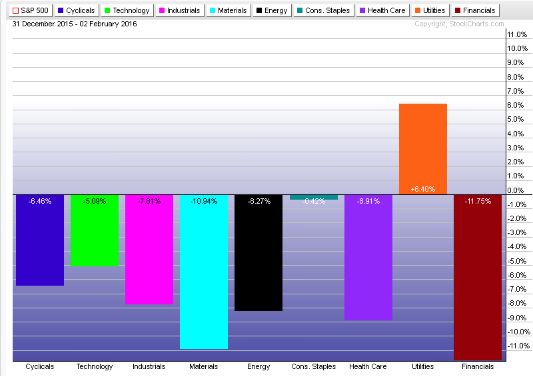
A look at the performance of US sectors shows that the weakness is widespread. Only the safe haven utilities sector is up in 2016.

The poor performance was offset somewhat by better than expected 4th quarter earnings. More than 70% of companies have beaten their EPS estimates.
This resulted in many stocks posting strong gains in response to these better than expected earnings. Unfortunately, many of the moves were short-lived as guidance about future earnings was disappointing.
Key Takeaway From Our January Stock Market Update
US stocks are off to a horrible start in 2016. The higher levels of volatility and the technical damage inflicted on stocks are taking a toll on market psychology. This is starting to spill over into the real economy.
We’re now in danger of entering into a negative feedback loop that could do serious damage to the real economy.
Good Investing,
Corey Williams
Note: Corey Williams writes and edits ETFTradingResearch.com. Sign up for our free ETF reports and free e-letter at http://www.etftradingresearch.com/free-sign-up. We’re devoted to helping you make more money from ETFs.
Category: Market Analysis


